Net Promoter Score (NPS) is a customer loyalty metric calculated by subtracting the percentage of detractors (scores 0–6) from the percentage of promoters (scores 9–10). The formula is: NPS = % Promoters − % Detractors. Scores range from −100 to +100, and any positive number is considered acceptable for most industries. This guide walks through the formula in four steps, shows a worked example, explains transactional vs relational NPS, and lists industry benchmarks so you can interpret your score with confidence.
As a business, you’re searching for an effective way to gather customer feedback. Sales are good, but it’s hard to know if things could be better. Are your customers truly satisfied?
Net promoter scores (NPS) are crucial for measuring customer satisfaction and loyalty, yet some businesses aren’t bothering to collect them. Could it be that their audience is too difficult to reach? Maybe they’re unsure how to calculate net promoter scores accurately and efficiently to use the information.
Without fully understanding NPS and how to collect and calculate them, you could be doing your business a disservice.
Learn two simple ways to calculate net promoter scores, how to interpret the calculations, ways to analyze the data, and more.
Table of Contents
- What Is Net Promoter Score (NPS)?
- NPS Breakdowns
- 2 Ways To Calculate Net Promoter Score
- Net Promoter Score Calculation Example
- 2 Methods for Interpreting Net Promoter Score Calculations
- Tips for Analyzing Net Promoter Score Calculations
- Calculate Net Promoter Score the Easy Way with AnnounceKit
What Is Net Promoter Score (NPS)?
Net Promoter Scores (NPS) can greatly affect companies, both negatively and positively. They are used to help gauge how customers view a company through customer loyalty, satisfaction, and enthusiasm.
The big question to ask: “On a scale of 0 to 10, how likely are you to recommend this product/company?”
The timing of sending an NPS survey can impact the response, so knowing when is the best time to take action matters. With these responses, companies of all sizes can improve upon customer service, support, delivery, and more.
How do you increase your NPS? By earning more enthusiastic customers that can be easily tracked over time.
AnnounceKit helps businesses take advantage of a wider customer base when it comes to sending NPS surveys and receiving scores. With an easy-to-implement widget, companies can garner the most valuable responses from their companies and work to increase their NPS over time.
Quick Setup, Easy to Use, and Many Integrations
Manage your product announcements from a single place and easily distribute them
across multiple channels.
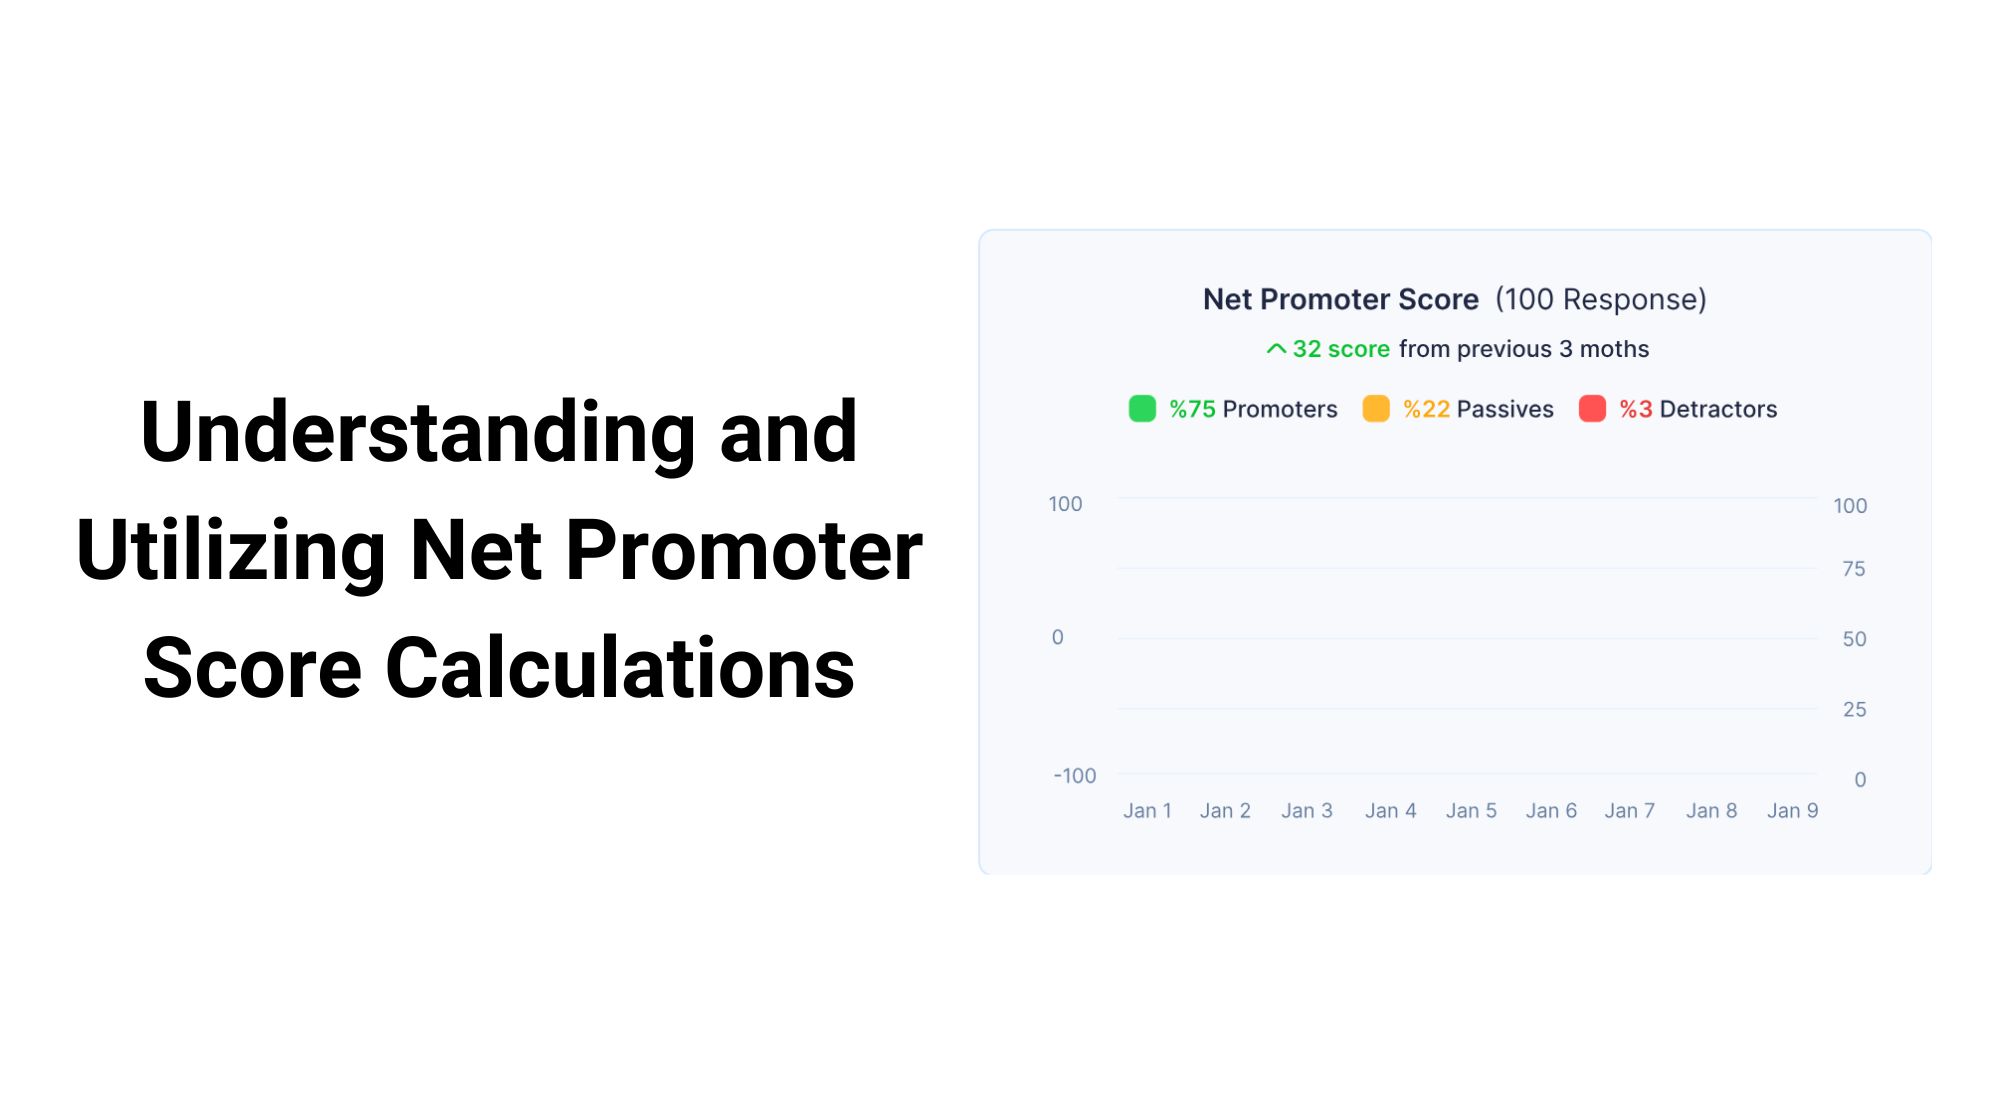
NPS Breakdowns
A Net Promoter Score is given on a scale of 0-10, so understanding what each numeric score means based on where it falls can be helpful. They are classified into one of three categories:
- Detractors
- Passives
- Promoters
0-6: Detractors
As you might imagine, these lower-end scores represent a group of unhappy or dissatisfied customers. They are highly unlikely to both purchase from you again and recommend your product or company to others.
For these reasons, this group is important to pay close attention to by addressing them with insights that help you better understand their experience and why it was unfavorable. You can then use this information to improve your business.
Once you’ve made the necessary changes to address those noted pain points, you can calculate another NPS to determine if the changes made were successful.
7-8: Passives
This group can be tough to address because they didn’t necessarily have a bad experience, but they also weren’t very impressed, either. They might be quick to leave you for a competitor if there’s a shiny reason to make the change.
Companies want to pay close attention to this category because they can quickly become detractors by default. However, with the right changes, they can also easily become promoters.
9-10: Promoters
If your NPS falls in this range, you have a high percentage of promoters who are referring your business, which is great news.
How do you get more promoters? By making the customer experience as pleasant as possible.
Promoters are also the most cost-efficient form of advertising. They happily (at no cost to you) talk about your product or company because they were highly satisfied with their experience. But that doesn’t mean there’s no room for improvement.
With this category, take advantage of discovering what more you can do to improve their experience, helping keep them as promoters and not letting them fall to passives.
2 Ways To Calculate Net Promoter Score
As we mentioned, surveying customers is the easiest way to see how likely they are to recommend your company or product, depending on where they fall on the NPS scale breakdown.
To find your overall NPS, you can use one of two options.
#1: Net Promoter Score Formula
The formula for NPS is as follows:
Net Promoter Score = (Number of Promoter Scores/Total Number of Respondents) – (Number of Detractor Scores/Total Number of Respondents)
Simply plug your numbers into this equation to calculate your NPS.
#2: NPS Calculator
Using this calculator, plug in the appropriate numbers to calculate NPS:
Net Promoter Score Calculation Example
Refer to the following example when working through how to calculate NPS:
Your company surveys 100 customers and ends up with a result of 60 promoters, 30 passives, and 10 detractors. Based on the calculation, your NPS would be 50.
(Number of Promoter Scores/Total Number of Respondents) – (Number of Detractor Scores/Total Number of Respondents) = NPS
(60/100) – (10/100) = NPS
60% – 10% = 50%
2 Methods for Interpreting Net Promoter Score Calculations
You’ve collected NPS surveys and calculated your NPS score, now it’s time to interpret the data so you can best understand it and utilize it to improve your customer satisfaction, experience, and service.
How do you know if you have a good or bad NPS score?
First, set your NPS score as a benchmark for your company, then use the absolute and relative methods to learn how to contextualize your score through industry benchmarks.
#1: Absolute Method
This method puts your score into one category — you’re looking at it from one perspective.
For example:
- If your score is below zero, that implies customers are highly likely to warn others away from your company or product. It’s seen as a “bad” score because a majority of customers have had bad experiences and are highly likely to move on to a competitor.
- If your score is between 0 and 30, it is seen as “acceptable.” This low positive score indicates there are more promoters than passives or detractors, but there is room for improvement. Overall, your company is doing something right.
- A score between 30 and 50 is viewed as “pretty solid.” Your company has more promoters than detractors and its product, for the most part, delivers on value and a majority of your consumers are happy and would recommend you to others.
- A score higher than 50 is “awesome.” If you score here, you sit at the top of your industry and your customer experience is very positive.
#2: Relative Method
This method helps companies look at different NPS benchmarks to understand how much of a brand differentiator their customer experience is. Many companies will make their NPS scores public for this reason.
Benchmarks can depend on many factors, like:
- Competition within the industry
- Barriers to switching brands
- Customer tolerance and sensitivity
- And more
Using the relative method, some common industry benchmarks are as follows:
- Automotive industry – 33 to 63
- Software industry – 28 to 55
- Computer industry – 8 to 60
- Health insurance industry – 19 to 68
- Network and internet provider industry – 2 to 33
- Supermarket industry – 20 to 59
- Banking industry – 17 to 62
- Airline industry – 18 to 55
Tips for Analyzing Net Promoter Score Calculations
Calculating your score is just the first step — you have to look deep into the qualitative feedback to understand how to improve your score.
It’s also important to remember that a “good” NPS score for one industry or business will not be considered “good” for another. a positive NPS score:
For a SaaS (Software as a Service) company, a positive NPS score would be between +1 and +100 and a negative NPS score would be from -100 to -1. A neutral score would fall in between the two, 0 to +1.
Identify Patterns
By using a tried and trusted NPS tool, companies can collect NPS feedback, calculate NPS, and monitor trends to identify patterns.
When you monitor trends from survey results, you can uncover the patterns around what customers view as your company’s strengths and weaknesses and work to improve them.
Follow Up
When customers take the time to fill out or respond to a survey, a simple acknowledgment can go a long way for them. Let them know their response was appreciated and valued with a quick follow-up — a simple “Thank you for your response!” can work.
While you’re doing this, you can encourage them to spread the word about your product, especially if they are a promoter, and maybe even a passive. In your follow-up to a detractor, be sure to let them know their feedback has been heard and actions will be taken.
What Is a Good NPS Score? Industry Benchmarks for 2026
NPS scores live on a scale from −100 (every respondent is a detractor) to +100 (every respondent is a promoter). In practice, almost no company hits either extreme. As a general rule of thumb, any positive score means more customers love your product than dislike it. A score above +30 is considered good, above +50 is excellent, and above +70 is world-class — the territory occupied by companies like Apple and Tesla.
The catch is that “good” is industry-dependent. A +30 in telecommunications would be outstanding, while the same score in SaaS would be merely average. Before you celebrate or panic, compare your number to peers in your vertical. Here are the most commonly cited benchmark ranges based on aggregated public data from Bain & Company, Retently, and SurveyMonkey reports:
| Industry | Average NPS | Top-Quartile NPS |
|---|---|---|
| SaaS & Software | +30 | +50 |
| E-commerce & Retail | +41 | +60 |
| Financial Services | +34 | +55 |
| Insurance | +35 | +58 |
| Telecommunications | +22 | +40 |
| Healthcare | +27 | +52 |
| Hospitality & Travel | +39 | +62 |
| Automotive | +39 | +58 |
Use these as directional only — your absolute number matters less than the trend over time. A SaaS company moving from +18 to +28 in two quarters is in better shape than one stuck at a flat +35. Track NPS quarterly at minimum, and segment it by customer cohort, plan tier, and acquisition channel to find where your loyalty is strongest. If you need an off-the-shelf survey to get started, our ready-to-use NPS survey template covers the full question set and follow-up logic.
Transactional vs Relational NPS: Which One Should You Use?
Not every NPS survey is built the same. There are two distinct flavors — transactional NPS (tNPS) and relational NPS (rNPS) — and the difference matters more than most product teams realize. Picking the wrong one gives you noisy data that nobody trusts.
Transactional NPS (tNPS)
Transactional NPS fires immediately after a specific interaction: a checkout, a support ticket resolution, an onboarding completion, a feature usage event. The question is the same — “How likely are you to recommend us to a friend or colleague?” — but the context is hot. Customers answer based on the experience that just happened, which makes tNPS perfect for spotting friction in a particular workflow. If your onboarding tNPS is +45 but your billing-checkout tNPS is −10, you know exactly where to invest engineering time.
Use tNPS when you want operational signal: short feedback loops, high response rates per interaction, and the ability to A/B test specific flows. Run it inside the product, ideally as a non-blocking micro-survey that disappears after one click.
Relational NPS (rNPS)
Relational NPS is the classic version — sent on a fixed cadence (quarterly or biannually) to your entire customer base, regardless of recent activity. It captures overall sentiment about your brand and product, not any single touchpoint. rNPS is the number you report to the board, benchmark against industry averages, and trend over years to measure whether your product strategy is working.
Use rNPS when you need a stable, comparable health metric. Send it via email, in-app banner, or both, and resist the urge to oversample — surveying customers more than twice a year fatigues them and crashes response rates. Most mature SaaS teams run rNPS quarterly to a rotating sample of one quarter of the user base, so each individual hears from you only once per year.
Best practice: run both. tNPS catches issues as they happen; rNPS tells you whether the cumulative experience is improving. The two scores will diverge — that gap itself is a useful diagnostic. For context on what to do with the open-text responses, see our breakdown of customer feedback examples from top SaaS brands.
How to Calculate NPS in Excel or Google Sheets
If you only need to crunch a small batch of responses, a spreadsheet handles NPS just fine — no dedicated tool required. Drop your raw scores into column A starting at row 2 (with a header in A1) and use the formulas below.
Step 1: Count totals and segment buckets. Assuming responses sit in A2:A1000:
- Total responses:
=COUNT(A2:A1000) - Promoters (9–10):
=COUNTIF(A2:A1000,">=9") - Passives (7–8):
=COUNTIFS(A2:A1000,">=7",A2:A1000,"<=8") - Detractors (0–6):
=COUNTIF(A2:A1000,"<=6")
Step 2: Convert to percentages. If your promoter count is in B2 and total is in B5: =B2/B5*100. Repeat for detractors.
Step 3: Apply the NPS formula. With % promoters in B6 and % detractors in B8: =B6-B8. The result is your NPS, rounded to the nearest whole number.
Both Excel and Google Sheets handle this identically — the COUNTIF and COUNTIFS syntax is the same. For ongoing reporting at scale, this method gets unwieldy past a few hundred responses. That is when collecting and calculating NPS inside a purpose-built widget pays off — AnnounceKit handles bucketing, segmentation, and trend lines automatically so the spreadsheet stays optional.
Calculate Net Promoter Score the Easy Way With AnnounceKit
Measuring customer satisfaction and loyalty is crucial to creating a successful business, and gathering feedback is the best way to do this. How can you effectively and efficiently reach a large customer base and encourage them to offer a useful response?
NPS by AnnounceKit is a simple, single-survey question that easily gathers a score for a customer’s experience. When you calculate the net promoter score overall, you can find where your business sits compared to others in the industry.
AnnounceKit makes collecting and calculating net promoter scores simple to do. By using our widget, you can collect valuable feedback from users directly within your AnnounceKit account. Calculate the NPS, then use the analytics dashboard to help make sense of the data and insight.
Simplify the process of collecting and calculating net promoter scores with AnnounceKit.
Quick Setup, Easy to Use, and Many Integrations
Manage your product announcements from a single place and easily distribute them
across multiple channels.
Frequently Asked Questions About NPS
What is a good NPS score?
Any positive NPS means more customers love your product than dislike it. As a rule of thumb, anything above +30 is good, above +50 is excellent, and above +70 is world-class. Industry context matters: a +30 in telecommunications is exceptional, while the same number in SaaS is roughly the industry average. Always benchmark against your sector and track trend over time rather than fixating on a single absolute number.
How often should I run NPS surveys?
For relational NPS, quarterly is the sweet spot for most B2B SaaS companies — it gives enough volume to be statistically meaningful while avoiding survey fatigue. Stagger the sends so each customer hears from you no more than twice a year. For transactional NPS, fire it immediately after a key interaction (post-onboarding, post-support, post-checkout) and cap each customer at one tNPS prompt per month to protect response quality.
What is the difference between transactional NPS and relational NPS?
Transactional NPS (tNPS) is sent right after a specific event — checkout, support ticket, feature use — and measures sentiment about that one experience. Relational NPS (rNPS) is sent on a fixed cadence (quarterly or biannually) and captures overall loyalty to your brand. tNPS surfaces operational issues; rNPS provides a stable health metric for trending. Mature teams run both, because the gap between them reveals where the experience is breaking down.
Why are passives excluded from the NPS calculation?
Passives (scores 7–8) are satisfied but unenthusiastic. They are unlikely to actively recommend you, but they are also not actively criticizing you. The original NPS methodology, developed by Fred Reichheld at Bain & Company, intentionally focuses the score on the polarized ends — promoters who drive word-of-mouth growth and detractors who actively harm your reputation. Including passives would dilute the signal and obscure the loyalty extremes that actually predict business outcomes.
Can NPS be negative?
Yes — and it happens more often than companies admit. If 40 percent of respondents are detractors and 25 percent are promoters, your NPS is −15. A negative score means detractors outnumber promoters, which signals serious churn risk. It is not necessarily a death sentence (some industries, like cable TV, average negative scores), but it is a strong call to dig into the open-text feedback, identify the top three pain points, and close the loop with detractors personally before they leave.
How is NPS different from CSAT?
CSAT (Customer Satisfaction Score) measures contentment with a specific interaction on a 1–5 or 1–7 scale — usually asked as “How satisfied were you with…?” NPS measures long-term loyalty and likelihood to recommend on an 0–10 scale. CSAT is a snapshot of one moment; NPS is a leading indicator of growth via word-of-mouth and retention. Most customer-experience teams track both: CSAT for operational quality control, NPS for strategic loyalty trending.