A good NPS score for SaaS is generally considered to be 31 or higher. The SaaS industry average NPS sits around 31–41, while top performers regularly score between 50 and 70. If your score is above 50, you are in excellent territory. Above 70 is world-class. Anything below 0 signals that more customers are unhappy than happy — and that requires immediate attention.
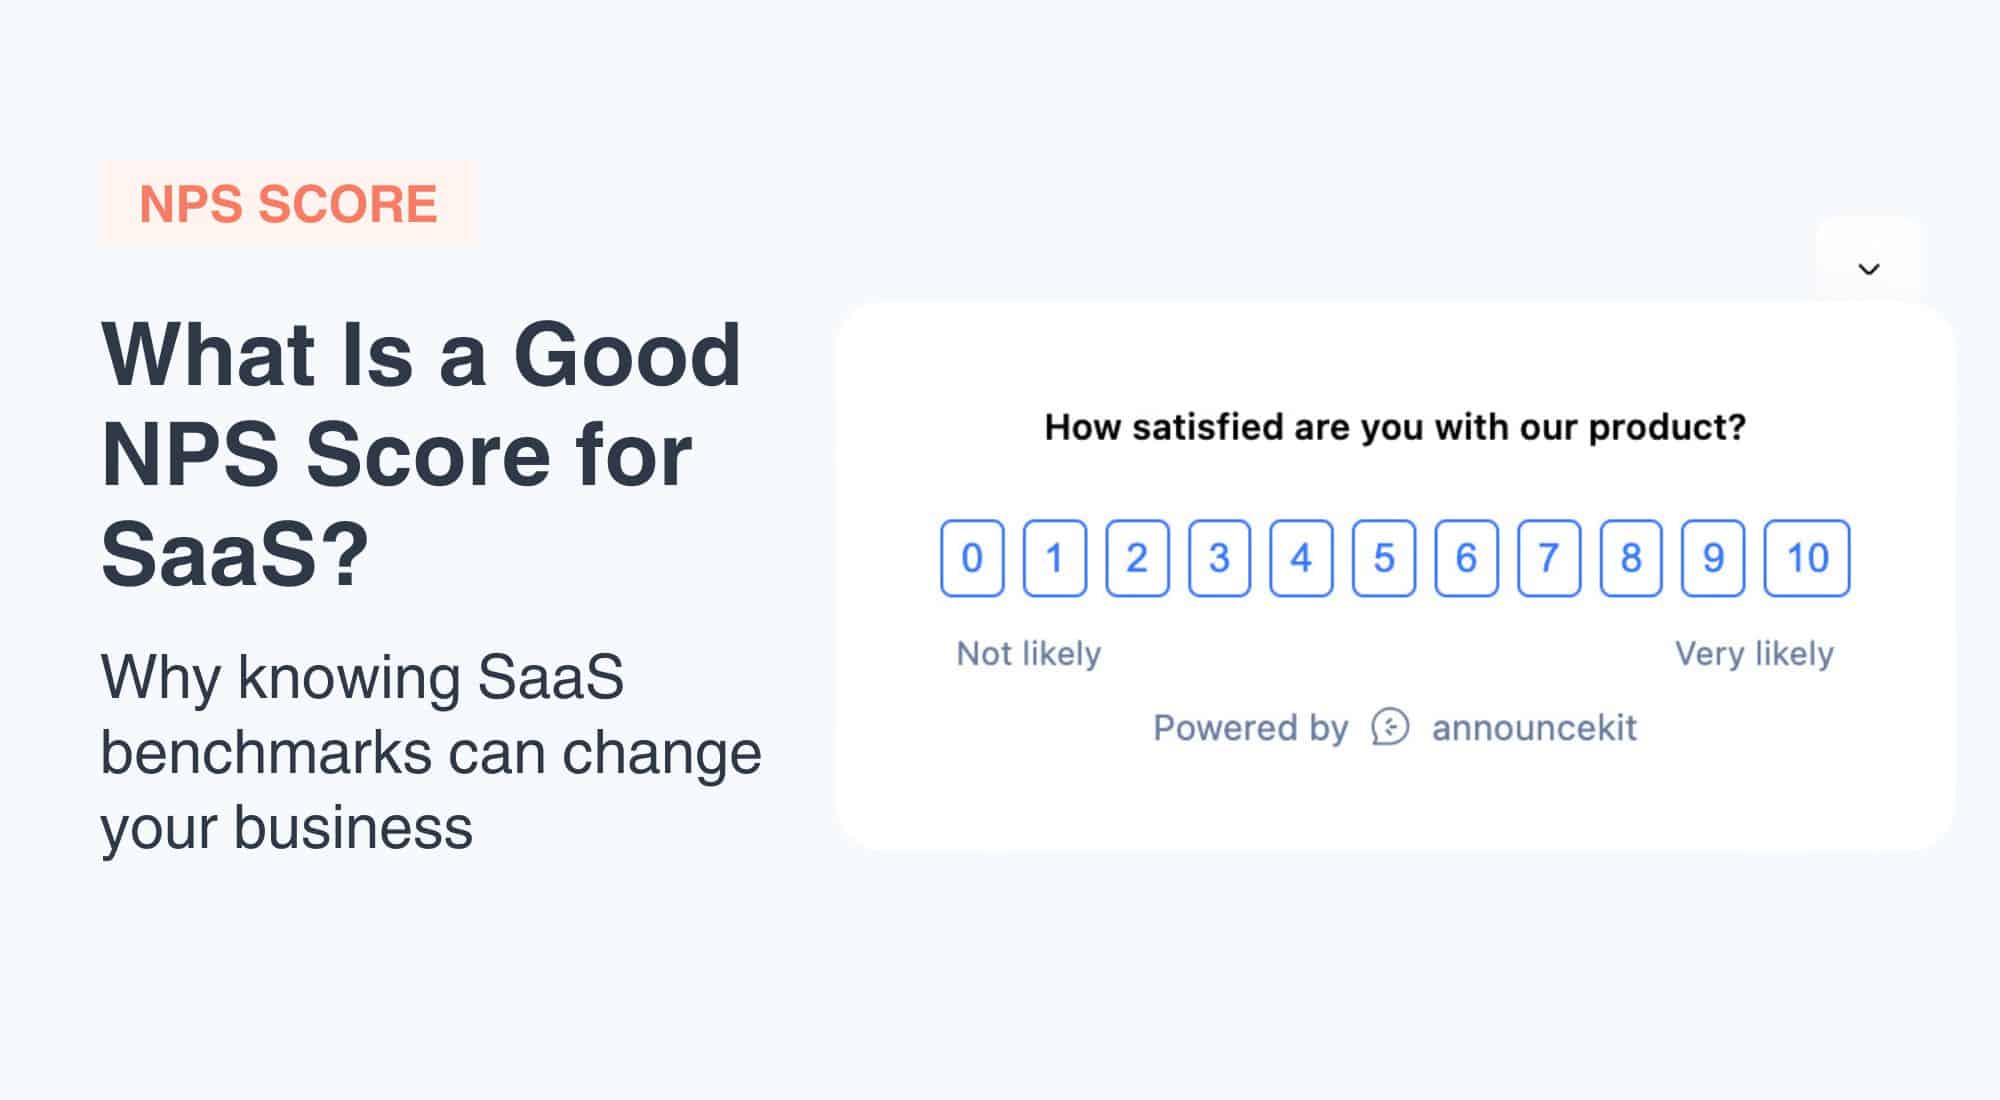
Net Promoter Score (NPS) is the single most widely used metric for measuring customer loyalty in SaaS. It asks one question: “How likely are you to recommend us to a friend or colleague?” on a scale of 0–10. The result — a number from -100 to +100 — tells you whether your customers are working for you or against you.
In this guide, you’ll find NPS benchmarks for 20+ real SaaS companies, a clear framework for interpreting your own score, the biggest challenges with NPS benchmarking, and actionable steps to improve. Let’s start with the data.
What Is NPS an Indicator Of?
NPS scores give a unique perspective into customer experience. Think of them as a temperature reading on how your SaaS offering or service is being received. Those scores then influence the way your business operates.
The Net Promoter Score gives insight into a customer’s happiness with your product, and subsequently their loyalty. Happy customers share their experience with others, so an NPS score is also a key indicator in measuring future “promoters” — the people who actively drive your word-of-mouth growth.
NPS is a simple but effective metric that SaaS companies use to understand their performance through a customer’s eyes. It is most powerful when tracked over time, combined with qualitative follow-up questions, and benchmarked against industry data.
How Does an NPS Score Work?
NPS offers a straightforward measurement of customer sentiment and gives a roadmap for how to implement meaningful changes to grow the customer base and keep recurring revenue high. Because customer satisfaction holds so much weight for SaaS companies, NPS scores often influence how sales and marketing address customer loyalty initiatives.
It’s important to note that measuring performance is always relative — what is considered a “good” NPS score for SaaS can vary by company size, segment, and stage.
What Is a Good NPS Score for SaaS?
Industry, focus, competition, and unique customer base all factor into what’s considered a “good” NPS for a SaaS company. That said, the following benchmarks hold broadly across the industry:
- Above 70: World-class — you have an exceptionally loyal customer base that actively refers others.
- 50–70: Excellent — top-quartile SaaS performance. This is where leading tools like Zoom and Slack operate.
- 31–49: Good — above average for SaaS. Most healthy, growing SaaS companies fall in this range.
- 0–30: Average — room for improvement, especially if competitors score higher.
- Below 0: Needs immediate attention — more customers are unhappy than happy.
What Is the Average NPS Score in SaaS?
The SaaS industry average NPS is approximately 31–41, depending on the segment and survey methodology. B2B SaaS tends to cluster around 40–41. Consumer-facing SaaS tools like video conferencing or entertainment platforms often score higher due to lower switching costs and more emotional product engagement.
Why Is Your NPS Score Important?
Net Promoter Score is arguably the most relevant metric for measuring customer loyalty in SaaS. An NPS score is vital in gauging:
- Word-of-mouth influence: Positive customer experiences and recommendations have a significant impact on business success. NPS software helps you identify and nurture promoters while mitigating the risk of negative word-of-mouth.
- Customer satisfaction and loyalty: Understanding your customer’s likelihood to recommend your product provides a clear indicator of their satisfaction and loyalty. Use NPS to drive customer-centric strategies and foster long-term relationships.
- Competitive advantage: By benchmarking your NPS against industry standards, you gain insights into how you stack up against competitors and identify areas where you excel.
NPS data is relevant to every level of a SaaS organization, from executives to frontline staff. SaaS companies can use their NPS scores to forecast business growth, customer loyalty, and overall brand satisfaction.
SaaS NPS Benchmarks: Real Scores from 20+ Companies (2026)
One of the most useful things you can do with your NPS score is compare it to real companies at scale. Below is a benchmark table of NPS scores from well-known SaaS and tech companies, compiled from publicly reported data and industry surveys.
| Company | NPS Score | Category |
|---|---|---|
| Zoom | 72 | Video Conferencing |
| Slack | 51 | Team Communication |
| HubSpot | 62 | CRM / Marketing |
| Salesforce | 34 | CRM / Enterprise |
| Adobe | 57 | Creative / Enterprise |
| Netflix | 67 | Streaming / Consumer |
| PayPal | 65 | Fintech / Payments |
| Dropbox | 43 | Cloud Storage |
| Shopify | 55 | E-commerce Platform |
| Zendesk | 30 | Customer Support |
| Intercom | 36 | Customer Messaging |
| Atlassian (Jira) | 31 | Project Management |
| Asana | 42 | Project Management |
| Monday.com | 55 | Work OS |
| Notion | 54 | Productivity |
| Figma | 62 | Design / Collaboration |
| Calendly | 48 | Scheduling |
| Loom | 58 | Video Messaging |
| Stripe | 49 | Payments API |
| Twilio | 29 | Developer Platform |
Note: NPS scores fluctuate over time and vary by survey methodology. These figures represent publicly reported data and third-party research from 2023–2025. Use them as directional benchmarks, not absolute comparisons.
Key takeaways from this data: consumer-facing or high-delight tools (Zoom, Netflix, HubSpot, Figma) tend to score 50+. Infrastructure and developer-focused tools (Twilio, Zendesk, Salesforce) often score lower — not because they are inferior, but because their users’ relationship with the product is more transactional. This is exactly why comparing within your category matters more than comparing against the overall average.
How To Calculate Your NPS Score
SaaS companies typically send out NPS surveys to their customers with one question: “On a scale of 0 to 10, how likely are you to recommend our product to a friend or colleague?”
The NPS score ranges from -100 to +100 and is based on the responses to this question. How the customer responds segments them into one of three groups:
- Detractors (NPS 0 to 6) are customers who have had negative experiences and are unlikely to recommend your product.
- Passives (NPS 7 or 8) are satisfied but not enthusiastic — they do not count in the NPS calculation.
- Promoters (NPS 9 or 10) are loyal enthusiasts who actively recommend your product to others.
To calculate your NPS score: % of Promoters − % of Detractors = NPS
For example, if 60% of respondents were Promoters and 20% were Detractors, your NPS would be 40 — right at the SaaS average. Passives (20% in this example) are excluded from the formula.
What Is a Good NPS Score for B2B SaaS?
The average Net Promoter Score for B2B SaaS sits around 40–41. Anything above 50 puts you in the top quartile for B2B SaaS. The B2B context matters because business buyers are more deliberate and less emotionally driven than consumers, which naturally compresses scores toward the middle.
A score above 40 in B2B SaaS is good. A score above 55 is excellent. A score above 65 is exceptional and typically associated with products that are deeply embedded in their customers’ workflows.
What Is a Bad NPS Score for B2B SaaS?
In the B2B SaaS world, an NPS below zero signals that more customers are actively unhappy than satisfied. But even scores in the 0–20 range deserve attention when competitors are scoring 40+. A “bad” score is contextual — it is bad relative to what your segment benchmarks show, and bad relative to your own previous score if you are trending downward.
Why NPS Benchmarks Are Hard to Compare
The NPS benchmarks above are useful reference points, but they come with important caveats. NPS scores are notoriously difficult to compare across companies because the methodology, timing, and audience vary significantly. Understanding these limitations helps you avoid over-interpreting your number — in either direction.
Industry and product type drive large differences. A CRM serving enterprise procurement teams will almost always score lower than a consumer video tool — not because it is worse, but because enterprise buyers evaluate products more critically and have higher switching costs. Comparing your B2B SaaS CRM to Netflix’s consumer NPS is not a fair benchmark.
Survey timing and channel matter. An NPS survey sent immediately after a successful onboarding call will capture very different sentiment than one sent after a support ticket. Companies that survey right after positive interactions tend to report inflated scores. When comparing benchmarks, it is worth asking: when and how was this NPS collected?
Company size and customer tenure affect results. Early-stage startups often report high NPS because their first customers are early adopters and champions. As a company scales to tens of thousands of customers, NPS typically regresses toward the mean. A 60 NPS at 500 customers and a 45 NPS at 50,000 customers may reflect equal — or even better — customer satisfaction at scale.
Cultural variation introduces bias. Customers in different countries use rating scales differently. US customers tend to give higher scores than European customers across all industries. If you serve a global customer base, segmenting NPS by region will give you a cleaner read than a single aggregate number.
B2B vs. B2C dynamics. Business buyers assess products through a rational, ROI-focused lens. Consumer buyers are more emotionally driven. This is why B2C SaaS consistently outscores B2B SaaS in raw NPS numbers — it reflects the relationship type, not quality differences.
The most useful NPS comparison is your own score over time. If your NPS is improving quarter over quarter, that signal matters far more than whether you beat a competitor’s published number.
Is Your NPS Score Actually Good? A 4-Step Diagnostic
Rather than asking “is 40 a good NPS score?” in the abstract, the better question is: good for whom, compared to what, measured how? Here is a four-step framework for evaluating whether your NPS is where it needs to be.
Step 1: Compare to your direct segment benchmark. Use industry-specific NPS data rather than the overall SaaS average. A 35 NPS for an enterprise security tool is excellent; a 35 for a consumer productivity app is below average. Find 3–5 named competitors in your exact category and benchmark against them specifically.
Step 2: Track your trend over time. A score of 42 that was 28 six months ago is a strong positive signal, even if 42 is not remarkable in isolation. Direction matters. Set a baseline, measure consistently on the same cadence, and judge your progress against your own history first.
Step 3: Segment by customer cohort. Your overall NPS hides important information. Segment by plan tier (free vs. paid), company size, industry, and tenure. Customers on your highest plan should ideally score highest. If your enterprise customers score lower than your free-tier users, that is a retention risk that your blended NPS would obscure.
Step 4: Benchmark over your release and change cadence. Measure NPS before and after major product releases, pricing changes, or onboarding overhauls. This ties your NPS data to specific business decisions and tells you which changes drove positive or negative shifts in sentiment.
How Measuring NPS Survey Data Can Help Improve Your Business
What’s most important when evaluating an NPS score is to look at the trends and changes over time. Regularly measuring NPS and taking strategic actions based on customer feedback is essential for maintaining and growing a strong customer base in SaaS.
Collecting additional qualitative data and follow-up questions from your customers provides deeper insights into their specific needs and areas for improvement. The open-ended follow-up — “What is the main reason for your score?” — is often more valuable than the number itself.
AnnounceKit’s NPS software gives you new insight to better understand and enhance your customer loyalty. With AnnounceKit you can make data-driven decisions based on NPS feedback and drive improvements to better optimize your customer experience. Collecting user feedback from your SaaS customers becomes systematic rather than ad hoc when you have the right tooling in place.
What a 10-Point NPS Improvement Is Worth in Revenue
NPS is not just a satisfaction score — it has a direct financial impact. Research by Bain & Company (the firm that invented NPS) consistently shows that companies with higher NPS grow revenue at more than twice the rate of their competitors. Here is a simple way to estimate what improving your NPS is worth to your business.
The formula: NPS improvement impact = (additional Promoters created) × (average referral revenue per Promoter)
If you have 1,000 customers and improve your NPS from 30 to 40, you have added roughly 100 more Promoters (assuming 10% of your base shifted from Passive to Promoter). If each Promoter refers 0.5 new paying customers per year and your average contract value is $500/year, that 10-point NPS improvement is worth: 100 × 0.5 × $500 = $25,000 in new ARR per year — just from referrals, not counting the retention improvement from having fewer Detractors.
At higher ACVs or larger customer bases, the math becomes even more compelling. A 10-point NPS improvement for an enterprise SaaS company with 5,000 customers and a $10,000 ACV could represent over $2.5M in additional annual referral revenue. This is why customer success teams at growth-stage SaaS companies treat NPS as a revenue metric, not just a satisfaction metric.
How Is NPS for SaaS Different Than Other Industries?
Across industries, the basic measurement of customer loyalty and satisfaction is the same — but there are meaningful differences in how NPS is used and interpreted in SaaS because of the subscription business model’s distinct characteristics.
SaaS NPS scores are most helpful when coupled with other industry-specific metrics, including:
- Customer Lifetime Value (CLV)
- Churn rate
- Monthly recurring revenue (MRR)
- MRR Growth rate
- Renewal rate
- Revenue retention (Net Revenue Retention / NRR)
In SaaS specifically, NPS is closely correlated with churn. Detractors churn at significantly higher rates than Promoters. This makes NPS a leading indicator for retention — a Detractor today is a cancellation tomorrow if the underlying issue is not addressed. Many SaaS teams use low NPS scores as the trigger for proactive customer success outreach.
What About eNPS? Employee NPS Benchmarks for SaaS
eNPS — Employee Net Promoter Score — applies the same 0–10 framework to employees: “How likely are you to recommend working here to a friend?” It has become a popular internal culture metric for SaaS companies because it is simple to administer and provides a consistent benchmark over time.
eNPS scores for well-known SaaS companies give a useful reference point:
- HubSpot: eNPS of approximately 91 — consistently ranked one of the best places to work in tech
- Salesforce: eNPS of approximately 58
- Adobe: eNPS of approximately 57
The SaaS industry average eNPS is significantly higher than cross-industry averages because tech workers, especially at product-led companies, tend to be more satisfied with mission-driven work. A good eNPS for a SaaS company is generally considered to be 40 or higher. An eNPS above 60 is exceptional and signals strong internal culture and low voluntary turnover risk.
eNPS and customer NPS are not directly comparable — they measure different relationships — but companies with high eNPS tend to deliver better customer experiences over time. Engaged employees build better products and provide better support, which eventually shows up in customer NPS scores.
How To Run an NPS Survey for SaaS
The first and most strategic decision you’ll make is where to send your NPS survey — email, in-app, website, or other channel. Each channel reaches a different segment at a different moment in the customer journey, and that context shapes the response you will get.
As you’re building your NPS survey, carefully consider:
- Which type of NPS survey you want to run (relationship vs. transactional)
- How your NPS questions are worded and how many you include
- A clear survey name and title description
- Your visual elements and branding
- A sign-off to thank respondents for their time
AnnounceKit simplifies survey distribution to a specific audience, allowing you to segment customers, customize surveys for specific touchpoints, and gather feedback without requiring coding or design resources. Understanding when to send NPS surveys for maximum response rates is equally important — the cadence and timing directly affect both response rates and the quality of the data you collect.
AnnounceKit: Measure Customer Satisfaction and Increase Loyalty With Our NPS Software
Our suite of solutions features NPS software with an intuitive dashboard that visualizes and segments feedback in real time, allowing you to:
- Identify key drivers behind customer happiness
- Monitor and track trends, changes, and improvements
- Generate insightful reports for data-driven decision-making
- Identify seasonal variations
- Assess the impact of your initiatives on customer sentiments
Our robust data analytics can help increase your NPS score over time by identifying performance trends, isolating areas for improvement, and assessing the impact of changes. AnnounceKit requires no development or design resources — set up personalized surveys and start gathering feedback without technical overhead.
Frequently Asked Questions About NPS for SaaS
What is a good NPS score for a SaaS company?
A good NPS score for a SaaS company is generally 31 or higher, which puts you at or above the industry average. Scores between 50 and 70 are considered excellent, and anything above 70 is world-class. The most meaningful benchmark, however, is your own score compared to direct competitors in your specific category — a 35 for an enterprise security tool is strong, while a 35 for a consumer app tool may be below par.
What is NPS and how is it calculated?
NPS (Net Promoter Score) is a customer loyalty metric based on one question: “On a scale of 0–10, how likely are you to recommend us to a friend or colleague?” Respondents scoring 9–10 are Promoters, 7–8 are Passives (excluded from the calculation), and 0–6 are Detractors. Your NPS = % Promoters − % Detractors. The result is a number from -100 to +100.
What is a bad NPS score for SaaS?
Any score below 0 is technically negative and signals more Detractors than Promoters — an urgent problem that needs addressing. Scores in the 0–20 range are considered below average for SaaS and should prompt investigation, especially if competitors score 40+. Even a score that was previously higher but is now declining is a warning signal, regardless of its absolute value.
How does NPS differ between B2B and B2C SaaS?
B2B SaaS typically scores lower than B2C SaaS because business buyers evaluate products through a rational, ROI-focused lens rather than an emotional one. The B2B SaaS average is around 40–41, while consumer-facing SaaS products (video tools, productivity apps, entertainment platforms) regularly score 55–70. This is why comparing your B2B SaaS score against consumer benchmarks can be misleading — always compare within your category.
How often should SaaS companies run NPS surveys?
Most SaaS companies run relationship NPS surveys on a quarterly or semi-annual basis to track trends over time. Transactional NPS surveys (sent after specific events like onboarding, a support interaction, or a renewal) can be run continuously. Surveying too frequently leads to survey fatigue and lower response rates — quarterly is the most common cadence for growing SaaS companies. Consistency in timing matters more than frequency.
What can SaaS companies do to improve their NPS score?
The most effective NPS improvement actions are: (1) follow up with every Detractor within 48 hours to understand and resolve their specific issue, (2) identify the most common reasons for low scores and fix the underlying product or process issues, (3) identify what Promoters love and double down on those strengths, and (4) improve onboarding so that more customers reach their “aha moment” before the first NPS survey reaches them. Chasing the score itself rarely works — chasing the underlying customer experience always does.
How does NPS relate to churn in SaaS?
NPS is one of the strongest leading indicators of churn in SaaS. Detractors (scores 0–6) churn at significantly higher rates than Promoters (9–10) — often 3–5x higher in research across B2B SaaS companies. This makes NPS an early warning system: a drop in NPS today predicts elevated churn in the next 1–3 renewal cycles. Customer success teams at SaaS companies use low NPS scores as a trigger for proactive outreach before the customer reaches a cancellation decision.